The CPI line on your chart already says trend 71%.
TradingCipher Events puts every high- and medium-impact US release on your NinjaTrader 8 chart before it prints, with its trend probability: how often, since August 2023, the move of the first five minutes after that release held all the way to the close. You set it up once. It updates itself every day.
Trend probability by release
No charge until day 31. Cancel any time from your Whop orders page.
- 30 days free
- NinjaTrader 8
- Updates itself daily
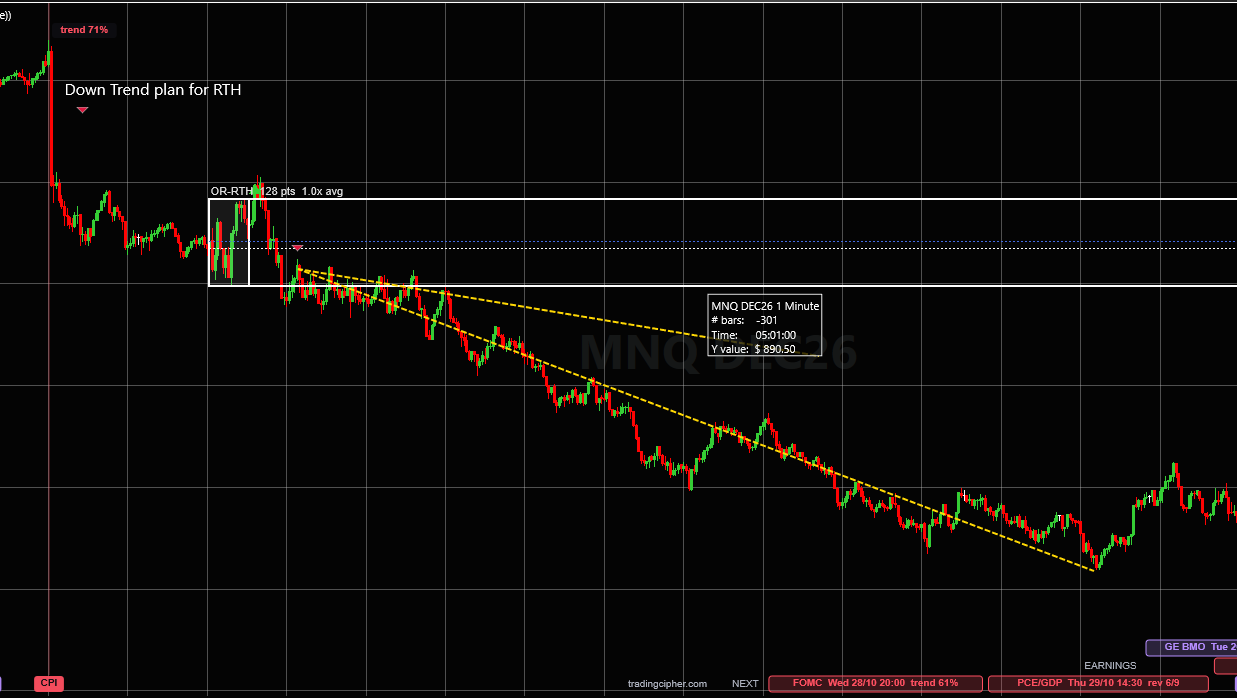
What "trend 71%" on a line means
Every release line carries one number: the probability, from the record, that this release turns into a trend day. It is counted the same way every time.
"trend 71%" on CPI means: on 27 of the last 38 CPI days the first five-minute move held to the close. A trend day 71% of the time. A count of the past, not a forecast of the next one.
The story
Why this exists
I trade MNQ on one-minute charts. For a long time the release calendar lived in another tab, and the release itself showed up on my chart only as a candle I had to explain afterwards. So I put the releases on the chart for myself: a line on the bar, the next ones pinned at the right edge.
Then I measured them. Every CPI, every jobs report, every Fed decision and the rest since August 2023, minute by minute, on the Nasdaq 100. The question was simple: after the first five minutes, which side did the day close on? The answer was not the same for every release.
That record is what the indicator writes on each line. It is not a forecast and it does not pick a side. It tells you what kind of day this release has tended to make, at the moment you are deciding how to trade it.
What stops most traders
Three things traders believe that are not quite true
I already have an economic calendar.A calendar tells you the time in another window. The chart is where you trade. Here the release is a line on the exact bar, the next ones wait at the right edge with the weekday and the time in your zone, and every past one is still there when you scroll back, so you can tell which spikes were news.
Release days are random. Nobody can say what follows.Nobody can say what the next one will do. But what each release has done is counted, and the releases are not alike: some hold their first move far more often than an ordinary morning, some reverse more often than they hold. The full record, every release, is free on this site.
Another tool to look after.The schedule comes from the agencies' own calendars and refreshes every day by itself. Install takes two minutes: import the zip, add it to a chart, paste the key. Then you forget it is there until the next release line appears.
The offer
What you get
- Every US release that moves the index, on the bar it printedThe big ones in red (CPI, PPI, the jobs report, retail sales, GDP, core PCE, the Fed), the medium ones in orange (JOLTS, durable goods, housing starts, new home sales, trade, import prices, productivity).
- The trend probability on every line"trend 71%" on CPI, "trend 87%" on JOLTS: how often the first five-minute move held to the close. It updates as new releases land. Two releases in the same minute get the record of the days they came out together.
- Nasdaq 100 or S&P 500 recordsEvery record is counted on both indexes. One setting picks which your chart shows: the Nasdaq 100 for NQ and MNQ, the S&P 500 for ES and MES.
- The NEXT stripThe coming releases pinned at the right edge with weekday, time and record, in the chart's time zone or one you choose. You see Thursday's release on Monday.
- Big-company earningsEvery US company worth $20 billion or more, marked before the open or after the close, with a size filter so earnings season stays readable.
- Daily updates, all yearNew dates, moved dates and new records arrive by themselves.
- The whole record behind it, freeEvery release minute by minute on this site, the method in the open, and the person who built it on the other end of the contact form.

The price
What is it worth to you?
Think about what this does for you. No more checking a calendar in another tab before every session. No more stop sitting right where an 8:30 candle is about to land because the chart never said a release was coming. And the record on every line: 497 releases measured minute by minute since August 2023, the kind of work you would never do yourself on a Sunday.
A single 10-point stop on one NQ contract is $200. Something that saves you time and keeps you out of even one of those is worth a lot more than a few dollars, right?
No charge until day 31. Cancel any time from your Whop orders page.
Proof on a chart
Four real days, marked up after the close
From my own 1-minute MNQ charts: my read of the day, and the moves I think were easier to take with the release line and its record on the screen. An example of trading from key areas of the RTH range, not a strategy and not results.
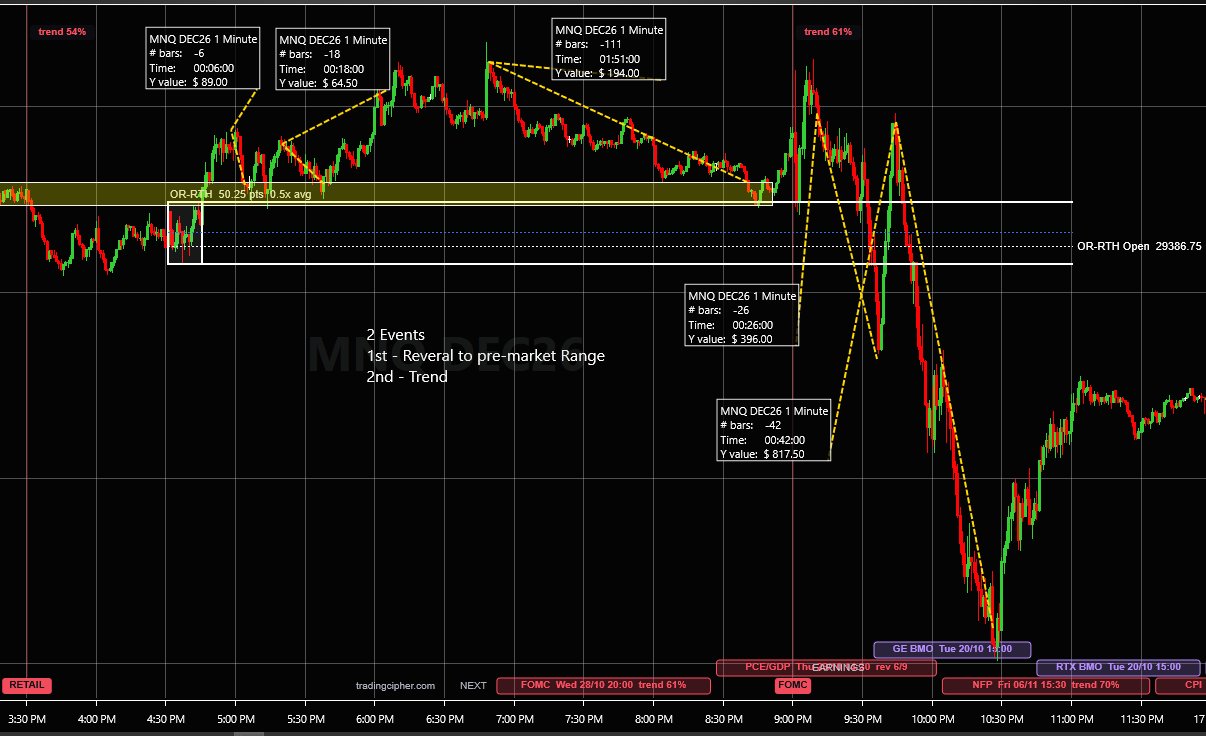
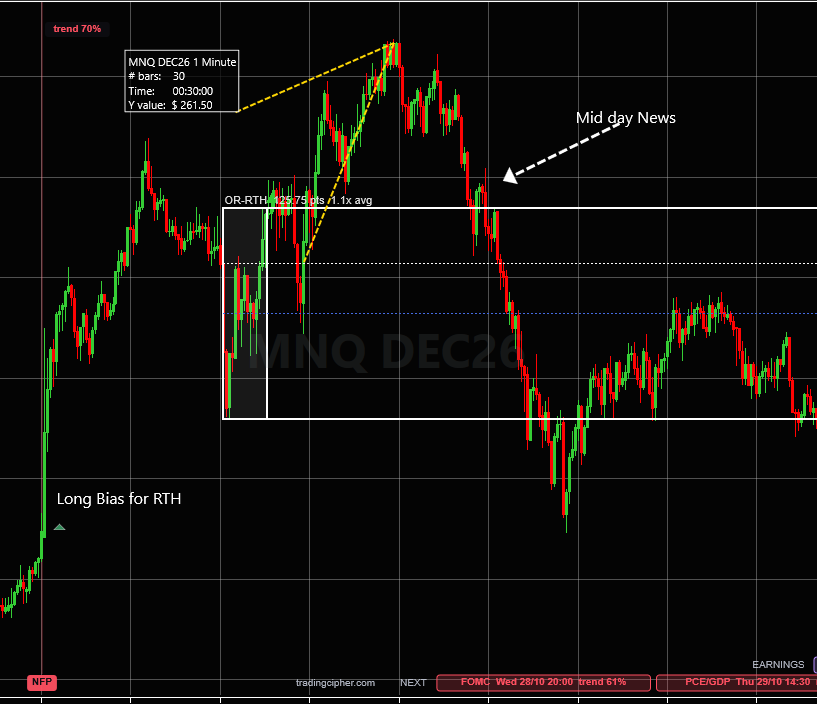
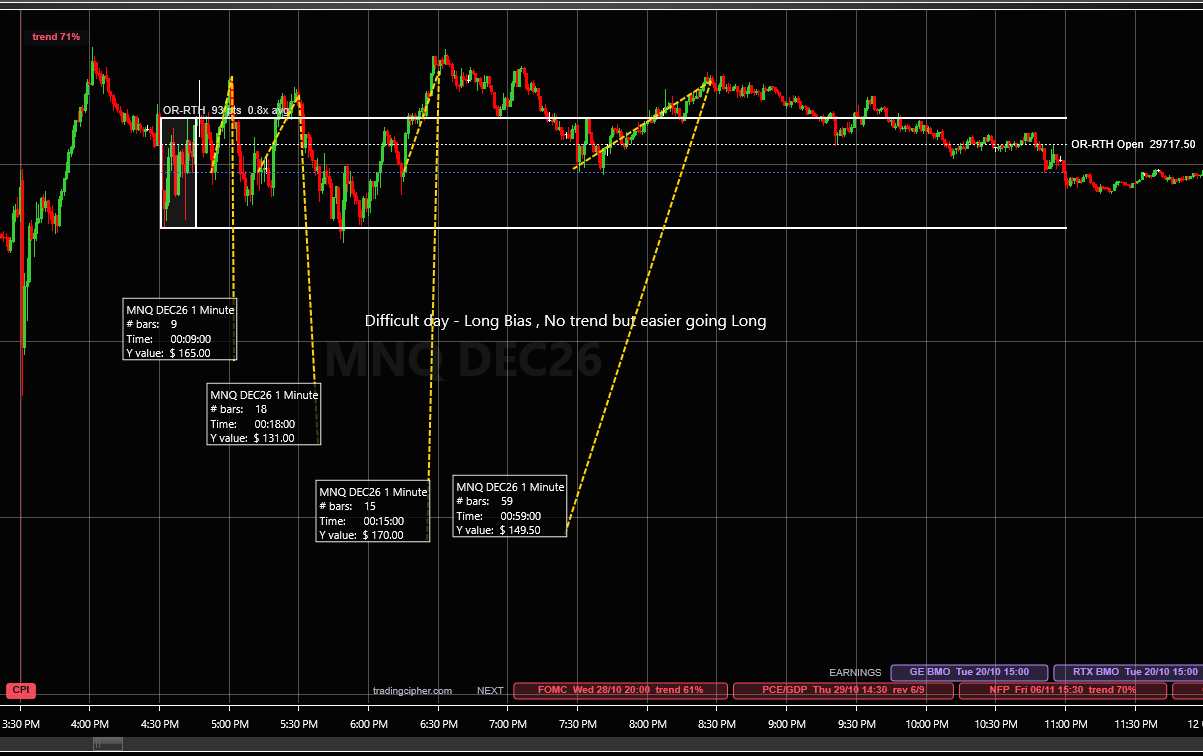
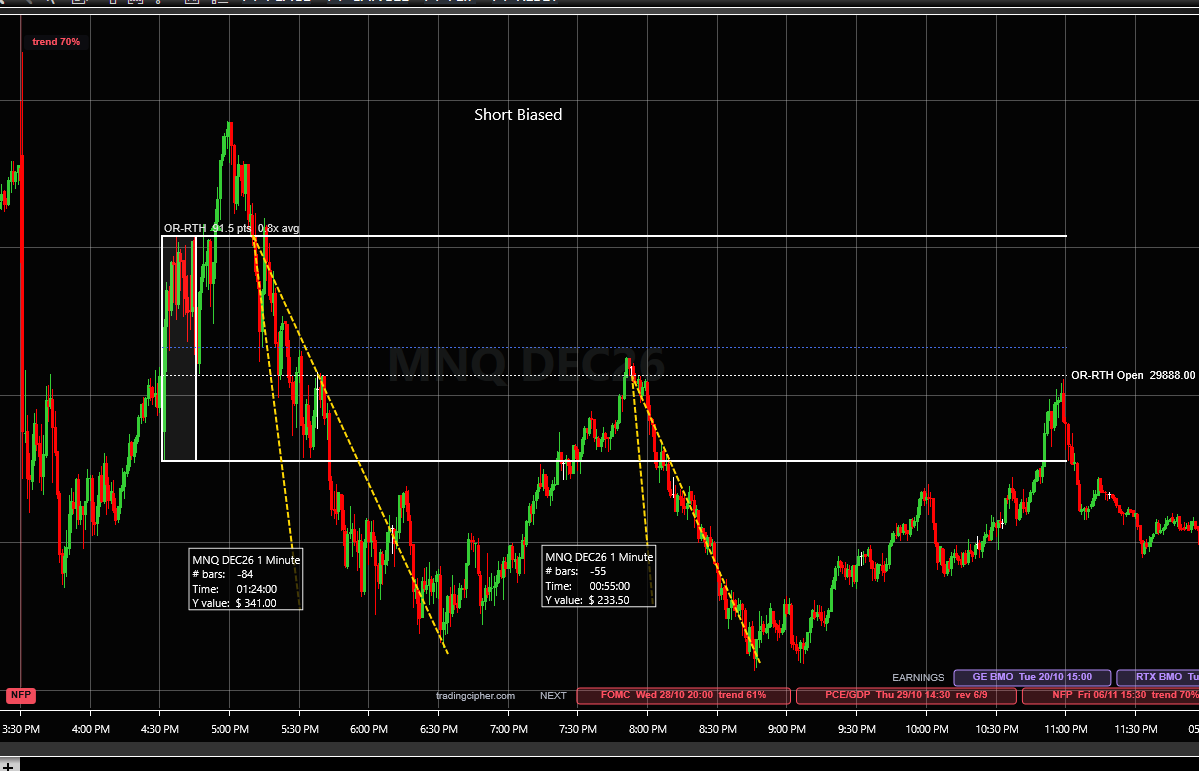
Click a picture to see it full size. Marked up in hindsight. The boxes on the dashed lines are NinjaTrader's ruler, measured after the fact, not trades taken and not results. Past moves say nothing about the next one. The RTH range box and the measuring lines are separate tools; TradingCipher Events draws the release lines, their records, the earnings marks and the NEXT strip.
Honest fit
Who it is for, and who it is not for
For you if
- you trade index futures on NinjaTrader 8 during the US morning
- you have been surprised by a release candle more than once
- you want to know what kind of day a release tends to make, without anyone telling you which way to trade it
Not for you if
- you want signals, entries or a forecast of the number
- you do not use NinjaTrader 8
- you only trade overnight or long after the US open
Questions
Before you start
Does it work on a prop firm account?
It draws on the chart and places no orders, so it works on whatever account and data connection your NinjaTrader 8 uses.
Can I use it on several charts?
Yes. One key covers one PC, and on that PC every chart and every instrument. It draws on time-based bars: seconds, minutes, days.
What happens after the free days?
On day 31 Whop charges $20 a year and the licence runs for a year from then. If you cancel before that, nothing is charged. Cancel any time from your Orders page on whop.com.
Is it a signal?
No. It does not tell you the number, the consensus or which way the market leans. It tells you when, and what happened the other times, and leaves the trade to you.
How do I install it?
NinjaTrader 8 on Windows, any data feed. Tools, Import, NinjaScript Add-On, pick the zip, add TradingCipher Events to a chart and paste the key into its settings. The download is here (version 1.2.0). Questions go through the contact form and are answered by the person who built it, usually the same day.
How do I update to a new version?
Tools, Remove NinjaScript Assembly, remove the old TradingCipherEvents, restart NinjaTrader, then import the new zip. If the indicator is missing from a chart afterwards, add it again and paste the same key. The download is here (version 1.2.0).
Put the record on your chart before the next release
$20 a year. The first 30 days free.
No charge until day 31. Cancel any time from your Whop orders page.
P.S. The next jobs report is Friday, November 6, at 08:30 ET. Start the trial today and it is on your chart before it prints, with its record.
Releases: Core Personal Consumption Expenditures (Core PCE) Consumer Price Index (CPI) Durable Goods Orders Fed Rate Decision (FOMC) Gross Domestic Product (GDP) Housing Starts and Building Permits Import and Export Prices Job Openings and Labor Turnover (JOLTS) New Home Sales Nonfarm Payrolls (NFP) Producer Price Index (PPI) Productivity and Unit Labor Costs Retail Sales Trade Balance (International Trade)