The CPI line on your TradingView chart already says trend 71%.
TradingCipher Events puts every high- and medium-impact US release on your TradingView chart before it prints, with its trend probability: how often, since August 2023, the move of the first five minutes after that release held all the way to the close. An alert reaches you a few minutes before each one.
Trend probability by release
Works on TradingView: access goes to your own TradingView username
The TradingView edition opens shortly. Leave your email and you get the day it opens, with the weekly email of the coming releases until then.
One email a week. One click to leave. Your address is not shared.
- TradingView
- Alert before each release
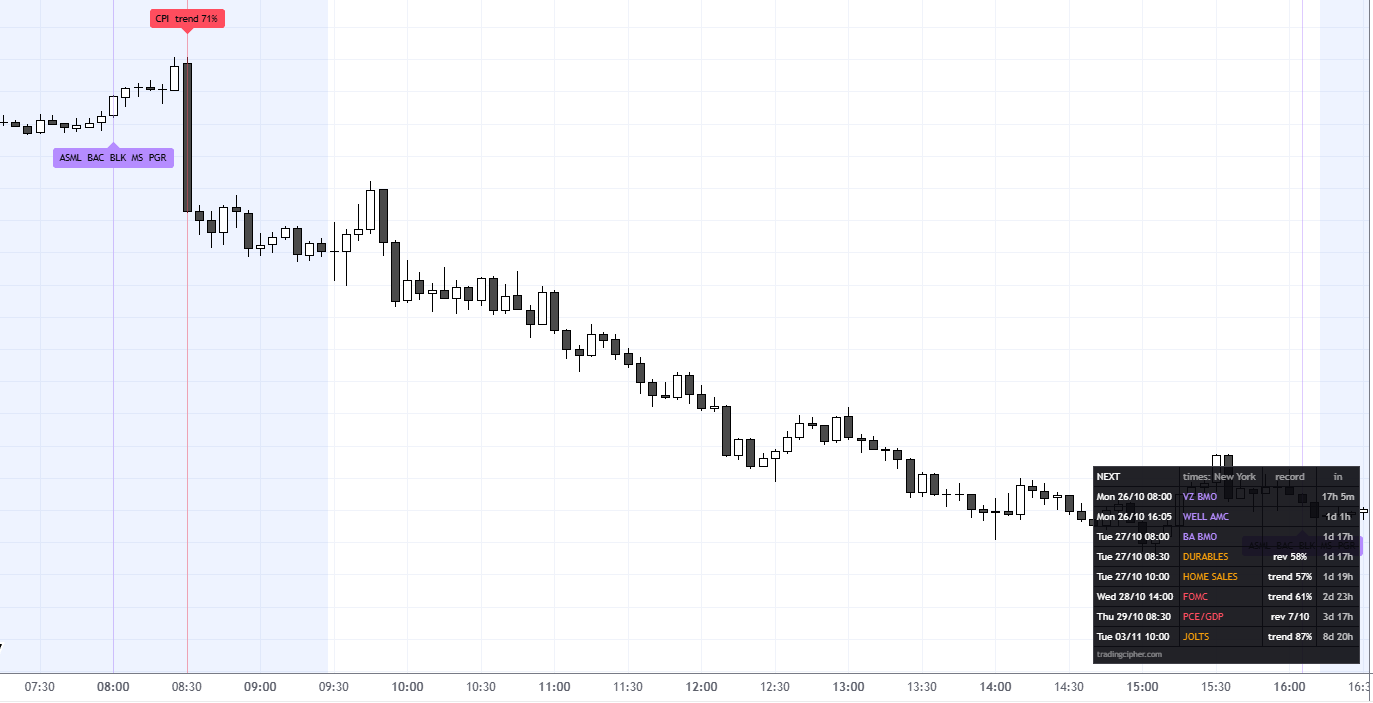
What "trend 71%" on a line means
Every release since August 2023, measured the same way on the Nasdaq 100.
What is on your chart
Every release, its record, and a warning before it prints
- Red and orange linesRed for the releases that move the index most (CPI, PPI, NFP, the Fed, retail sales, PCE, GDP), orange for the medium tier (JOLTS, durable goods, housing starts, new home sales, the trade balance, import prices, productivity).
- The record on each line"trend 71%" or "rev 58%", read before the release, not after it.
- Big-company earningsIn purple, below the bars, filtered by market cap.
- The next releases, ahead of timeDashed lines right of the last bar, and the NEXT table with the time in your zone, the record and the time left.
- An alert before each releaseSet one TradingView alert on the indicator and it reaches you a few minutes before every release, with its record in the message.
- Any symbol, any timeframeNQ, MNQ, ES, QQQ or a stock: the lines sit on the bar the release printed in.
- Nasdaq 100 or S&P 500 recordsEach record is counted on both indexes. One setting picks which the chart shows: the Nasdaq 100 for NQ and MNQ, the S&P 500 for ES and MES.
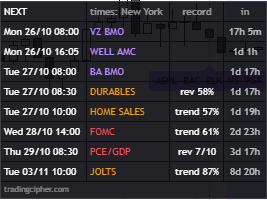
On a real chart
Four days on TradingView, including one that went the other way
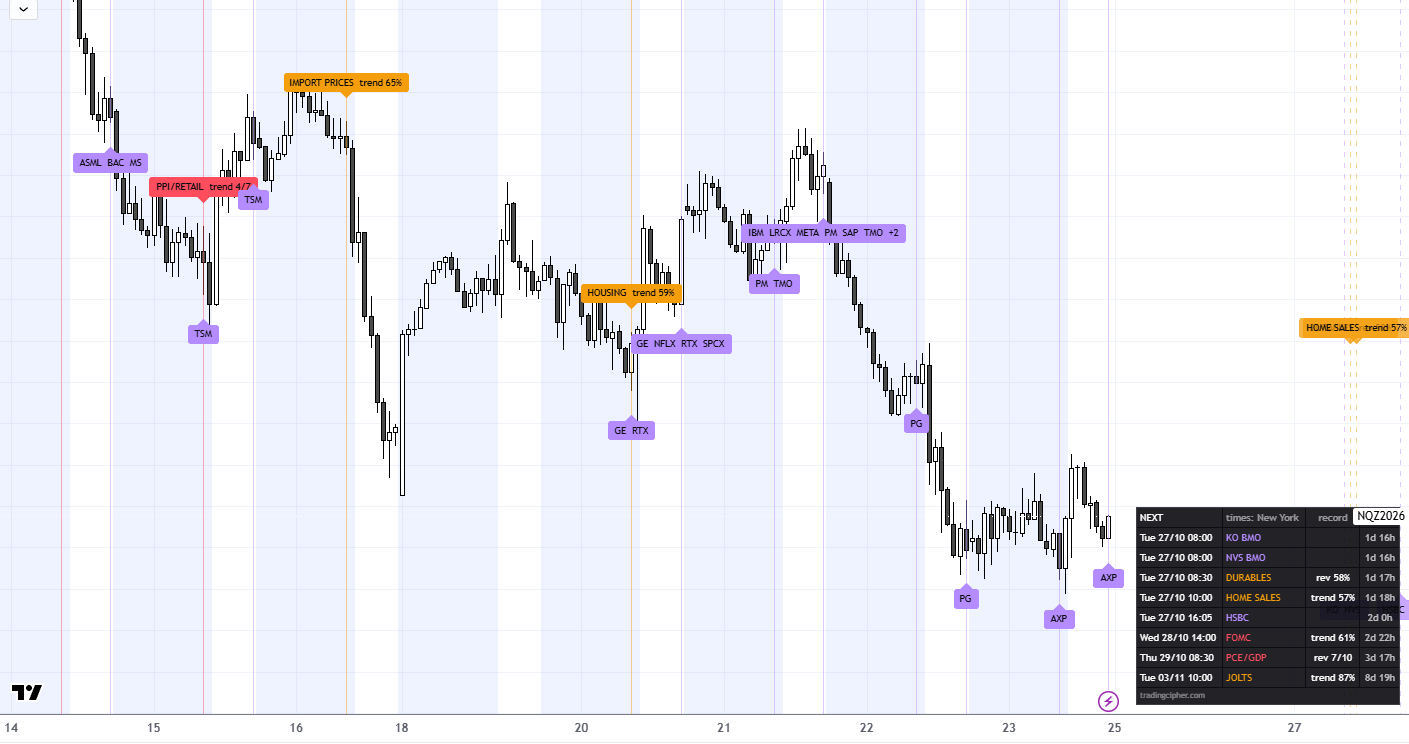
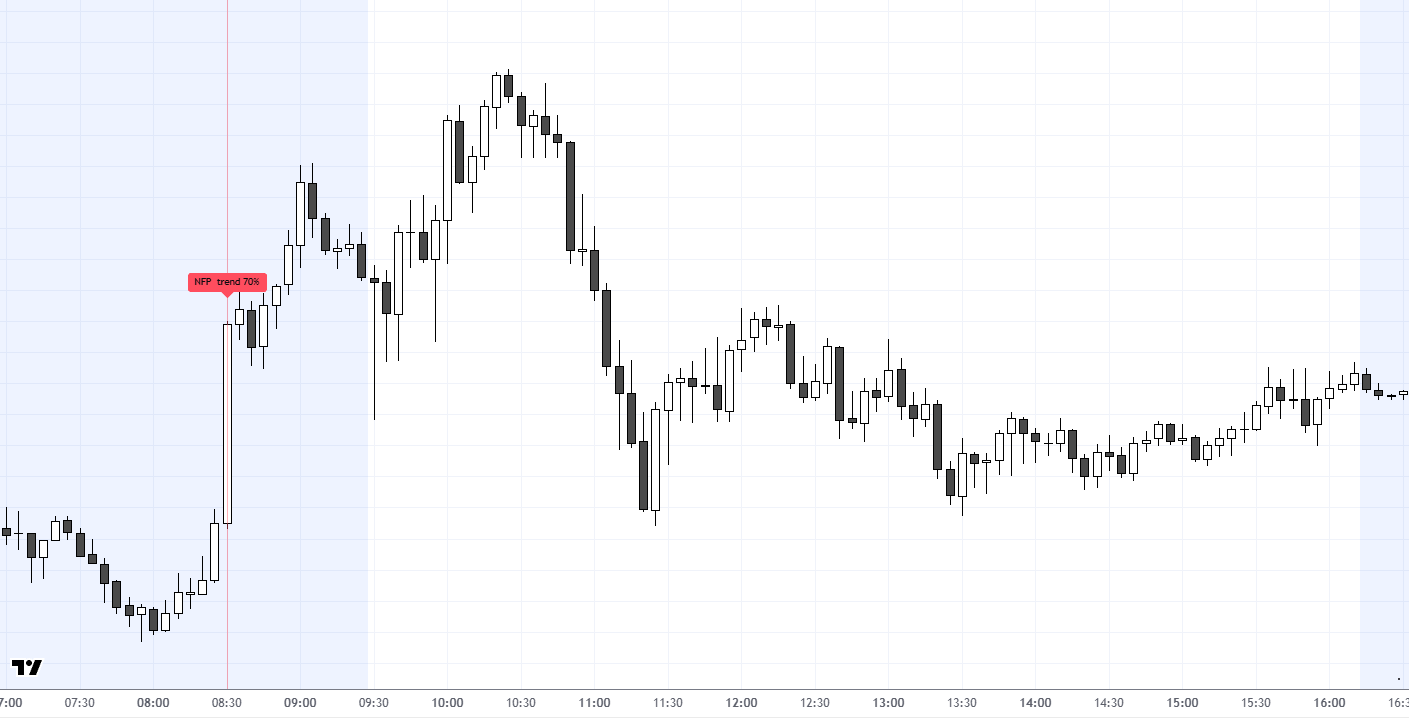
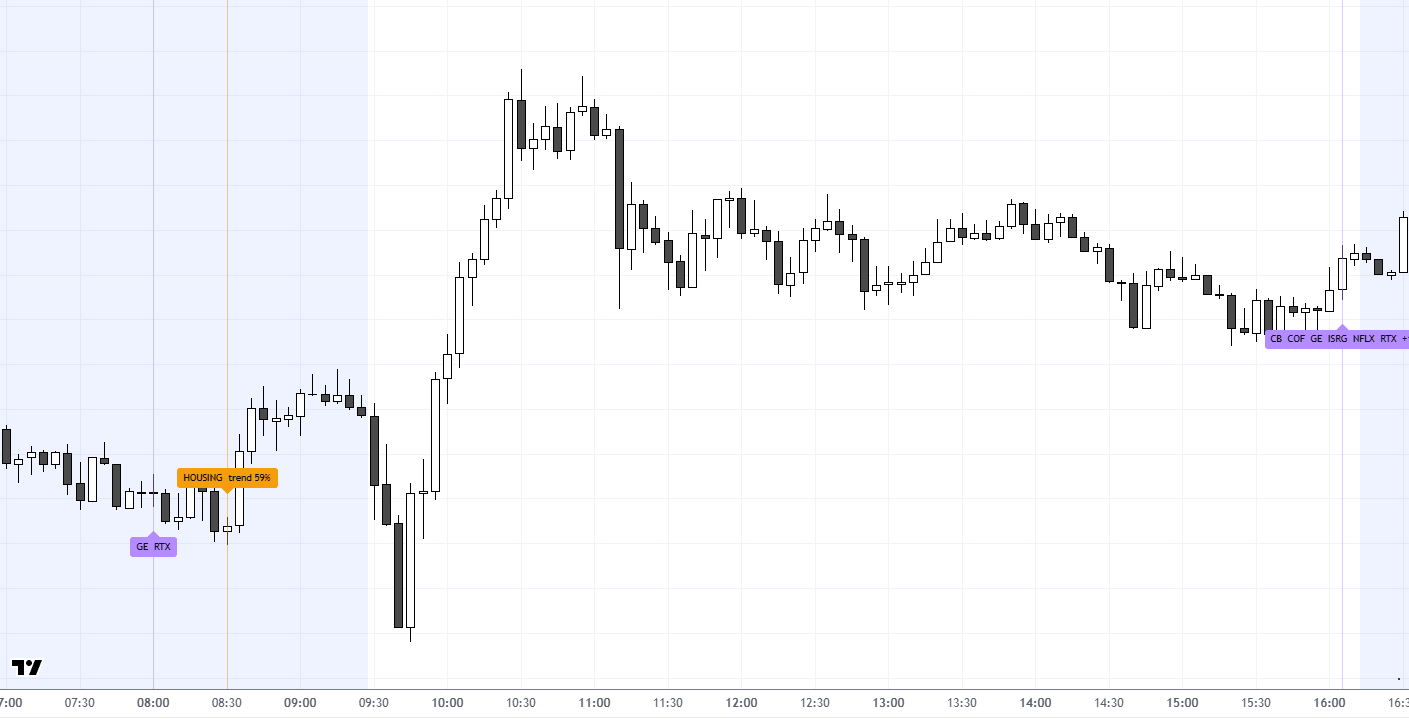
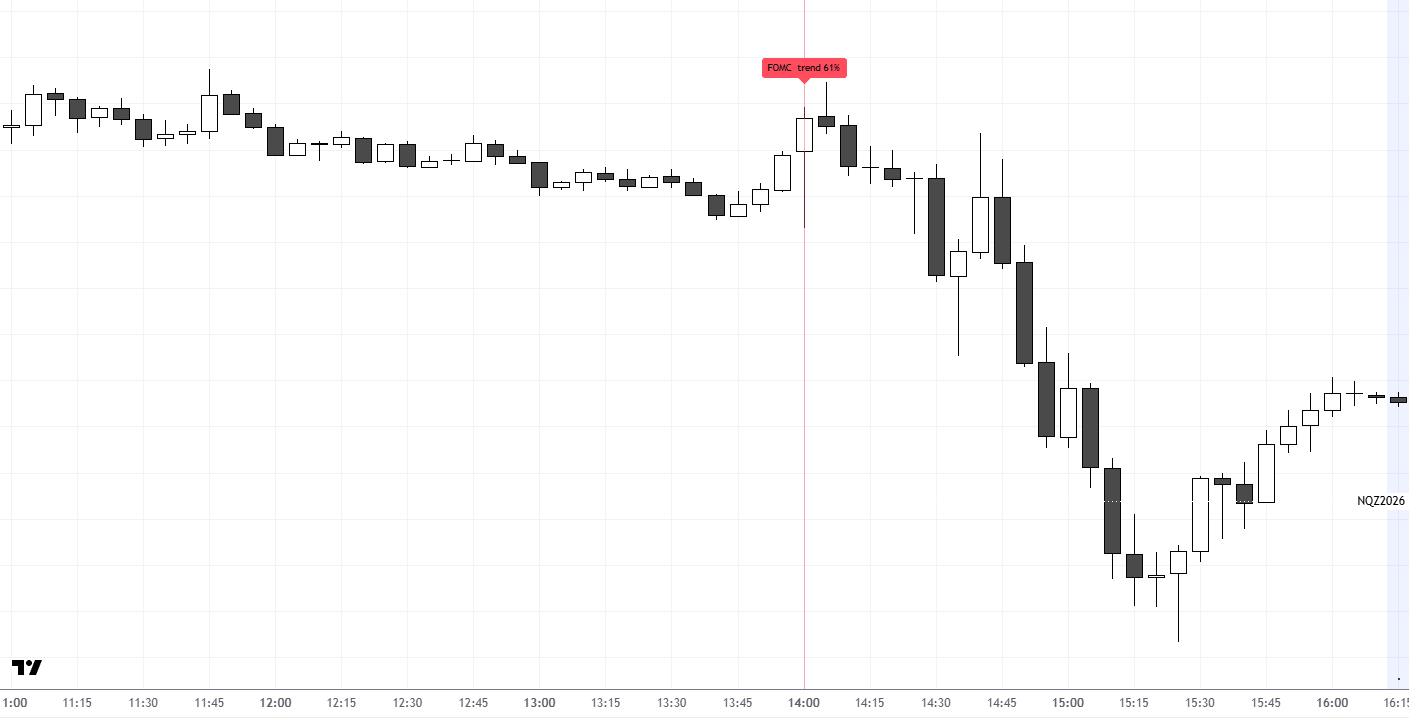
Click a picture to see it full size. Real days from the chart, picked to show what the lines look like, including a day the record did not hold. Past moves say nothing about the next one.
Questions
Before you add it
How do I get access?
TradingCipher Events is an invite-only script on TradingView. Access is given to the TradingView username you enter at checkout; it then appears under Indicators, Invite-only scripts.
Is it a signal?
No. It does not tell you the number, the consensus or which way the market leans. It tells you when, and what happened the other times, and leaves the trade to you. A count of the past, not a forecast.
How does it stay up to date?
The release calendar is set through 2027 and built into the script. Earnings dates are added as they are announced, and every update reaches your chart on its own.
I trade on NinjaTrader.
There is a NinjaTrader 8 edition with the same lines and records: TradingCipher Events for NinjaTrader 8.
Put the record on your chart before the next release
The TradingView edition opens shortly. Leave your email and you get the day it opens, with the weekly email of the coming releases until then.
One email a week. One click to leave. Your address is not shared.
TradingView is a trademark of TradingView, Inc. TradingCipher is not affiliated with TradingView.
Releases: Core Personal Consumption Expenditures (Core PCE) Consumer Price Index (CPI) Durable Goods Orders Fed Rate Decision (FOMC) Gross Domestic Product (GDP) Housing Starts and Building Permits Import and Export Prices Job Openings and Labor Turnover (JOLTS) New Home Sales Nonfarm Payrolls (NFP) Producer Price Index (PPI) Productivity and Unit Labor Costs Retail Sales Trade Balance (International Trade)